PDM Tutorial
* - experimental
Light Curve Fitting *
Generally, phased light curves are based on real photometric data obtained within an appropriate time frame. This limits the total number of points to be used as a basis for direct magnitudes interpolation. Once the possible period value is determined (see Searching a Period feature for details), the next advancement step in photometric data processing is a representation of a light curve in the form of analytical function. Some advanced mathematical methods are used to infer values of a function where no observed data are available. As most variable stars are periodic, it is possible to build a function which has the best fit to a series of photometric data points (smoothing). Smoothing is all about constructing a function that approximately fits the data.
This approach allows not only to match magnitudes to any given phase value within the observed data range, but - which is more important - expand those calculations (extrapolation) to the use of a fitted curve beyond the range of the observed data. Below you can see a sample of what is meant by analytical smoothing in term of phased light curve. You can see some data points scattered all around the mythical curved function. The main goal of the software is to calculate those functions on the fly.
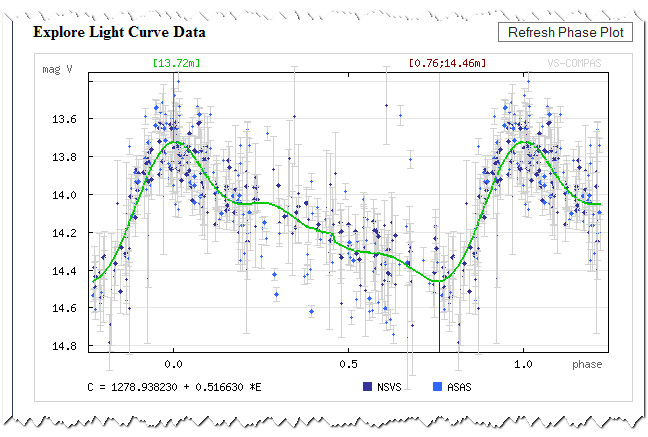
Smoothing a phased light curve data.
Further, a mathematical prediction of extremums can be compared to the corresponding values obtained from the real sky. Combined together, it will allow to improve the quality of the period value and build important O-C diagrams for variable objects.
Having an analytically represented function - rather than a discrete relation between time moments and corresponding magnitudes - opens up a lot of advantages in the field of light curve analysis. Besides mentioned ability of smoothing, or "averaging", the source data set, it comes up with a fundamental capability to study the analytic function by software (the tool itself), providing its best fit properties. The latter one is crucial for scientific world where all the data must be mathematically verified.
The PDM Light Curve Explorer has a built-in feature to make some light curve's analytics. The feature can be found under the Analysis tab and is extremely easy to use. Under the hood it does everything automatically, except just a couple of settings to be manipulated by an user. Typical screen will look like the following:
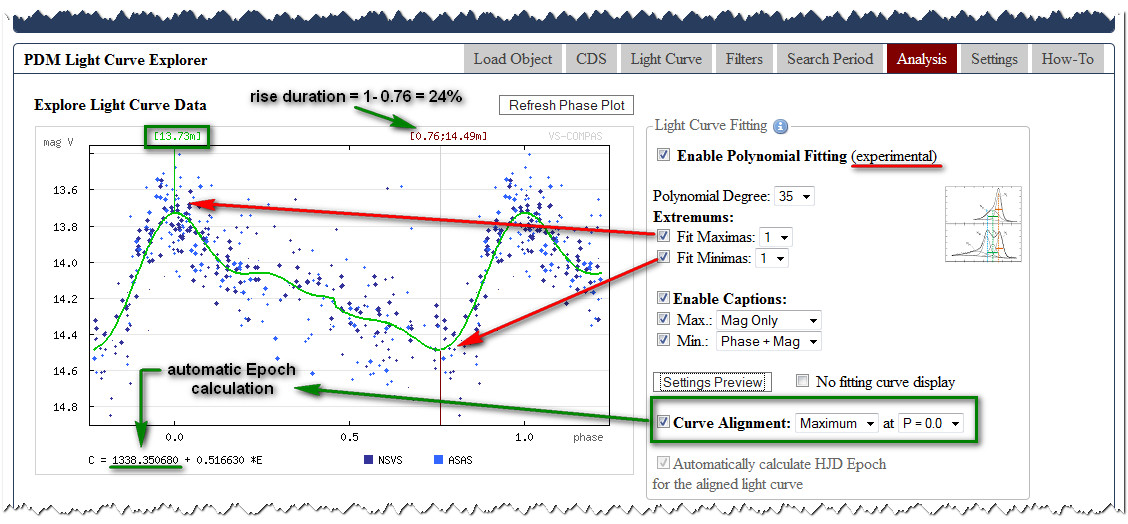
Typical Analysis screen view with the major features highlighted in color. (clickable)
Below you can find a short overview of settings available to the user.
Enabling the Feature
By default, the feature is turned off to reduce the resources usage. Since the service has on-line nature and requires quite a bit of CPU, an user has to explicitly update the view once the settings are changed. The current status is "experimental", which means that the use of the feature is optional and the result data provided "as-is". Further development will allow to generate trigonometric polynomial representation of the best-fit function.
Important Note: Though mathematically it is possible to "match" any set of points to some function, it may not have any sense in practice for those data sets. Thus, it is recommended to apply curve fitting to only those phased light curves with fairly strong period value found. Following this simple advice will match your expectations better any way.
An user can select a polynom degree to indicate the service what kind of fitting curve to match to. Less degree means "more smooth", but there is always a chance that small degree value will generate inappropriate result (too smooth). Larger degree value means "more detailed fitting". Providing a good degree value is more a human brain task at this point rather than software's, so the user should try a couple of degrees to find the best match. A proper result should demonstrate a smooth line that follows the points' locus at their best density/concentration.
Fitting Extremums
Light curves of different types of variable stars may have not a single maximum or minimum. It is fairly easy to detect those extremums visually. But that human like knowledge is not very useful for the software, where every piece of information must be uniquely identified using mathematics. The tool provides an ability to independently control the number of extremums to search for (it is usually 1 for pulsating variables and 2 for eclipsing binaries).
Also, an user have a control over caption's format: there are options to display extremum's phase value, corresponding magnitudes and their combination. Please, refer to the screenshot above for some details.
Phased curve alignment and Epoch determintaion
Having those extremums analytically identified allows to use this data for an automatic phased light curve alignment. This is very useful from all the points, since it can serve as an unbiased helper in an initial epoch (means phase "zero", the start of the cycle) determination.
More details on automatic alignment and extremums matching for different types of variables can be found here:
Light Curve Auto Positioning (experimental).
The rule is quite simple and obvious though: the less scattered data is - the more precise epoch detection you have. The advantage here is that an user don't need to make tons of server requests picking up the right epoch value using the Fixed-value Epoch/Period feature. And the result will be mathematically verified, upon the input data set.
Rise Duration value
Another application the feature provides is a help in rise/eclipse duration value determination. For example (please, refer to the screenshots above), in a case of pulsating variable star rise duration can be found as a minimum's phase complement to the [1.0]. Means, if the curve is perfectly aligned (maximum at phase 1.0) and the minimum occurs at phase [0.76], the rise duration value would be calculated as [1.0 - 0.76] = 0.24, or 24%. Similar approach can be applied to other well-shaped curves, wether pulsating or eclipsing binaries.
|
Project VS-COMPAS
| Variable Stars Common Observation Mission in Particular Areas of the Sky © 2011-2012
|